Looking at surfaces
Golfballs rolling on digital smoke
The fourth step mentioned in the Steps of a Simulation section was to process the ion flight information. Unlike with SIMION where data collection can yield useful information, the Simulation Playground has relatively little information to process aside from some numbers provided in the ion flight log. Most of the information you get from a simulation is simply the trace of the ion’s path.
In order to interpret a visualization, let’s make a simulation of an using what we’ve covered. We know from the section on Electric fields that we can’t just put two “rails” down, as they will appear the same voltage as the area between them — and the ions will likely collide with one of the rails, instead of being repelled. Instead, what we can do is put low voltage “blockers” nearer the ion’s path and high voltage rails outside these blockers. We’ll also put a slightly higher voltage electrode at the “start” of the ion’s path. This will provide some kinetic energy as the ion is repelled from this point.
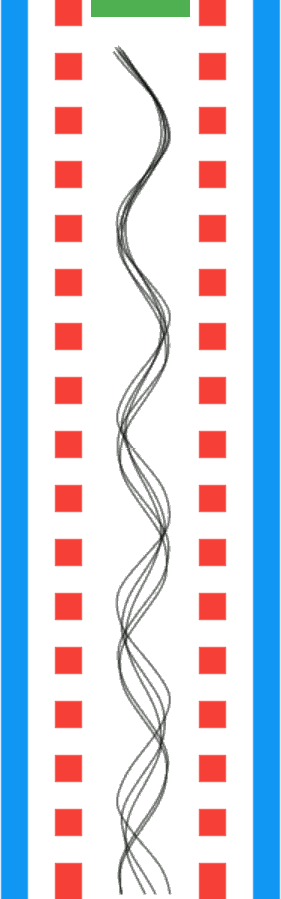
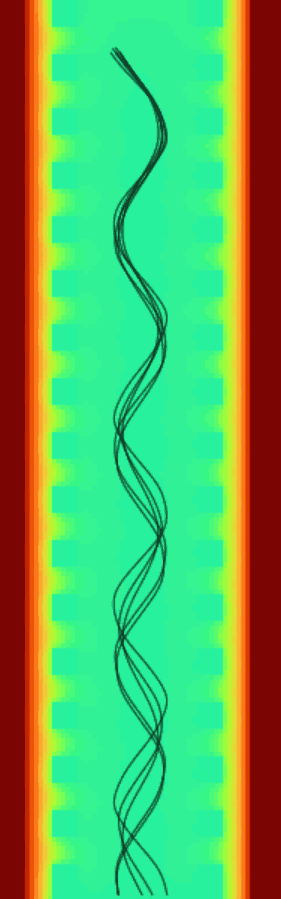
Above, we can see that this produced the correct motion of ions oscillating back and forth as they move from the “top” of the simulation to the bottom. Depending on subtle changes in the initial ion’s position, we can observe a large difference in its path and final location. In my opinion, the ions’ paths all appear reasonable. For instance, I can imaging a ball oscillating back and forth like the ion paths — although a ball’s oscillations would dampen as it rolled along the valley due to friction that doesn’t exist in our simulation.
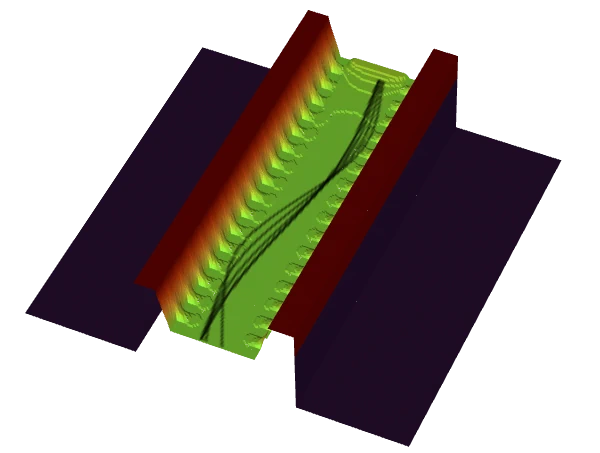
In addition to the ion paths, we can observe the electrodes and electric fields in the images above. The Simulation Playground displays all electric fields as a heatmap from dark red to dark blue — respectively, the highest and lowest voltages in the given simulation. In order to better visualize the fields, I added an even lower voltage electrode outside of the observable simulation above. This “trick” is a method of adjusting the heatmap to shift the colors and it highlights one of the shortcomings of using a heatmap for visualization. An alternate method of visualizing electric fields is to extend them into the third dimension and look at them as if they were actual topology. We can do so by ensuring that they are already refined and clicking the “Advanced” tab’s :
This is the strategy that SIMION takes and it often allows for a more intuitive understanding of why ions move like they do. If we want to, we can even load and refine our electrodes in SIMION from the Simulation Playground by clicking: .
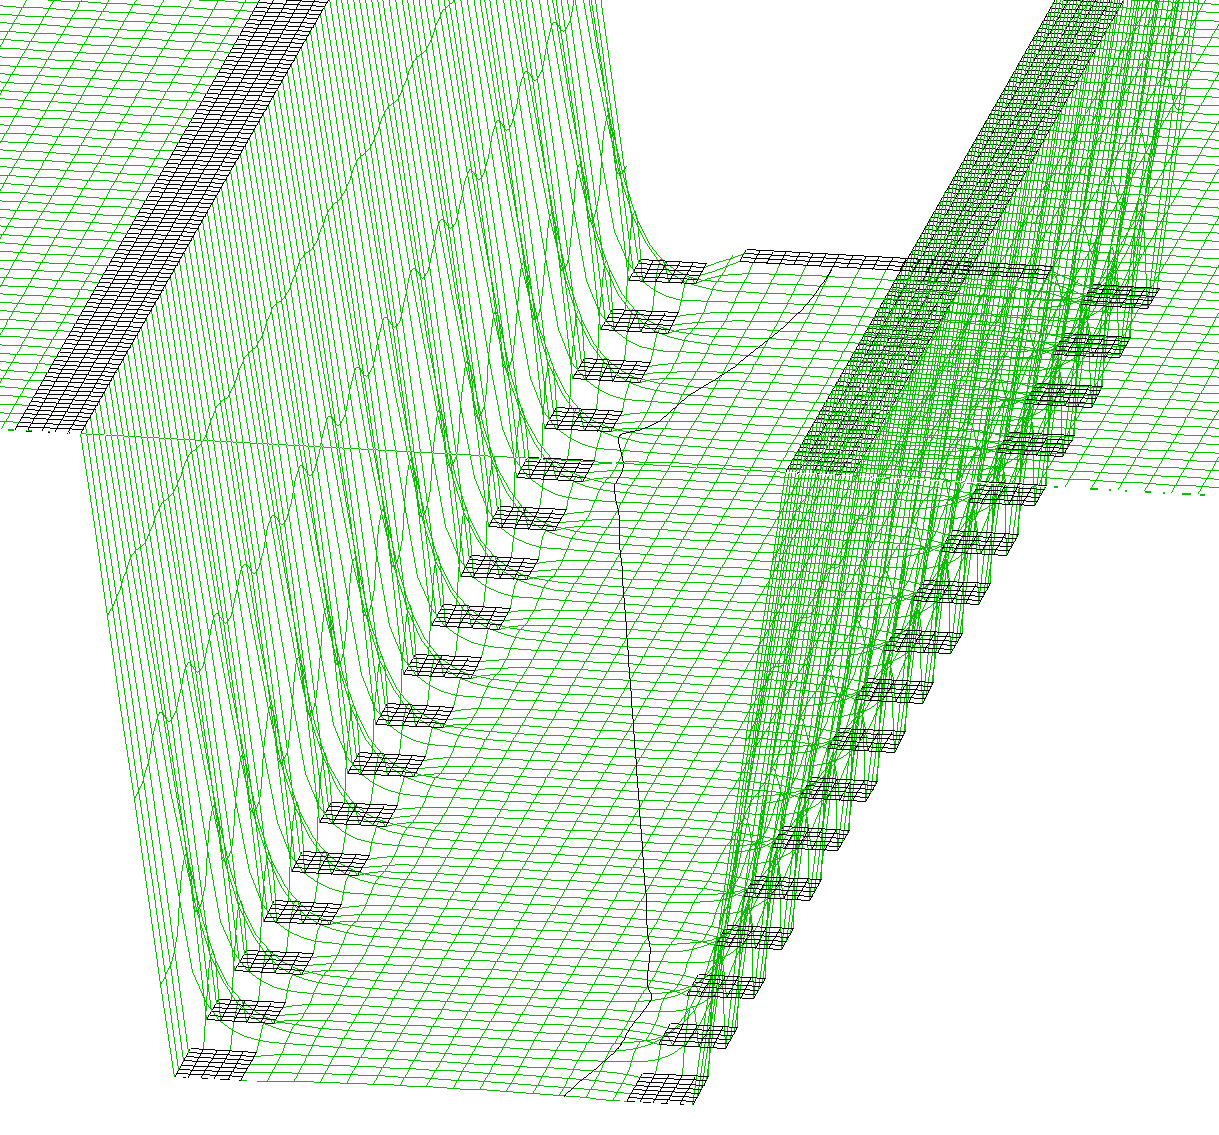
The potential energy images above make the view of the “valley” a bit clearer. Remember that the electrodes themselves are 2D. The electrodes are not physically higher or lower than one another — their voltages (potentials) are, and that is what we are visualizing.
We can also observe that the simulated ion in SIMION takes a different trajectory than the ions in the Simulation Playground — the trajectory is much straighter and has fewer oscillations. I do not know whether this is mostly due to differences in the ion spawn parameters or differences in accuracy of the simulations (SIMION is much more accurate, but should give similar results for trivial examples). Likely it is a bit of both.